Simon Eck, Stefan Wörz, Katharina Müller-Ott, Matthias Hahn, Andreas Biesdorf, Gunnar Schotta, Karsten Rippe, Karl Rohr
Abstract
The genome is partitioned into regions of euchromatin and heterochromatin. The organization of heterochromatin is important for the regulation of cellular processes such as chromosome segregation and gene silencing, and their misregulation is linked to cancer and other diseases. We present a model-based approach for automatic 3D segmentation and 3D shape analysis of heterochromatin foci from 3D confocal light microscopy images. Our approach employs a novel 3D intensity model based on spherical harmonics, which analytically describes the shape and intensities of the foci. The model parameters are determined by fitting the model to the image intensities using least-squares minimization. To characterize the 3D shape of the foci, we exploit the computed spherical harmonics coefficients and determine a shape descriptor. We applied our approach to 3D synthetic image data as well as real 3D static and real 3D time-lapse microscopy images, and compared the performance with that of previous approaches. It turned out that our approach yields accurate 3D segmentation results and performs better than previous approaches. We also show that our approach can be used for quantifying 3D shape differences of heterochromatin foci.
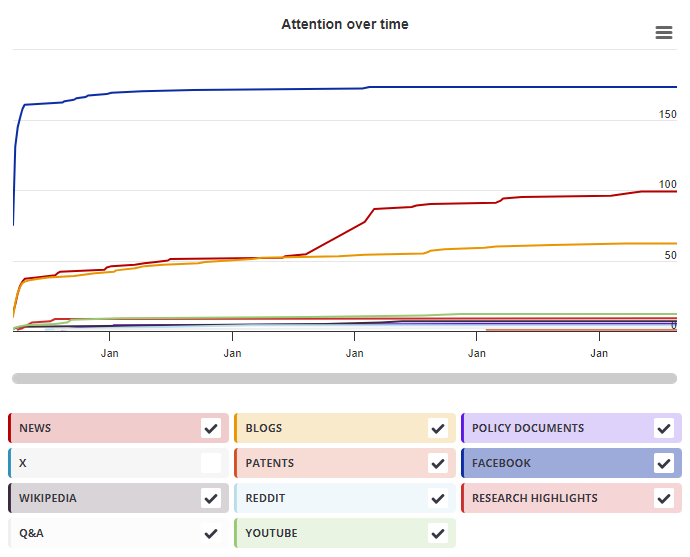
This research output has an Altmetric Attention Score of 1. This is our high-level measure of the quality and quantity of online attention that it has received. This Attention Score, as well as the ranking and number of research outputs shown below, was calculated when the research output was last mentioned on 03 April 2016.
All research outputs
#17,285,668
of 25,374,647 outputs
Outputs from Medical Image Analysis
#1,222
of 1,653 outputs
Outputs of similar age
#201,342
of 329,941 outputs
Outputs of similar age from Medical Image Analysis
#12
of 17 outputs
Altmetric has tracked 25,374,647 research outputs across all sources so far. This one is in the 21st percentile – i.e., 21% of other outputs scored the same or lower than it.
So far Altmetric has tracked 1,653 research outputs from this source. They typically receive a little more attention than average, with a mean Attention Score of 5.3. This one is in the 19th percentile – i.e., 19% of its peers scored the same or lower than it.
Older research outputs will score higher simply because they've had more time to accumulate mentions. To account for age we can compare this Altmetric Attention Score to the 329,941 tracked outputs that were published within six weeks on either side of this one in any source. This one is in the 30th percentile – i.e., 30% of its contemporaries scored the same or lower than it.
We're also able to compare this research output to 17 others from the same source and published within six weeks on either side of this one. This one is in the 1st percentile – i.e., 1% of its contemporaries scored the same or lower than it.